Knowledge Graph
The Knowledge Graph is an interactive visualization that shows how your knowledge base content connects. It maps relationships between concepts, topics, and entities found in your documents.What the Graph Shows
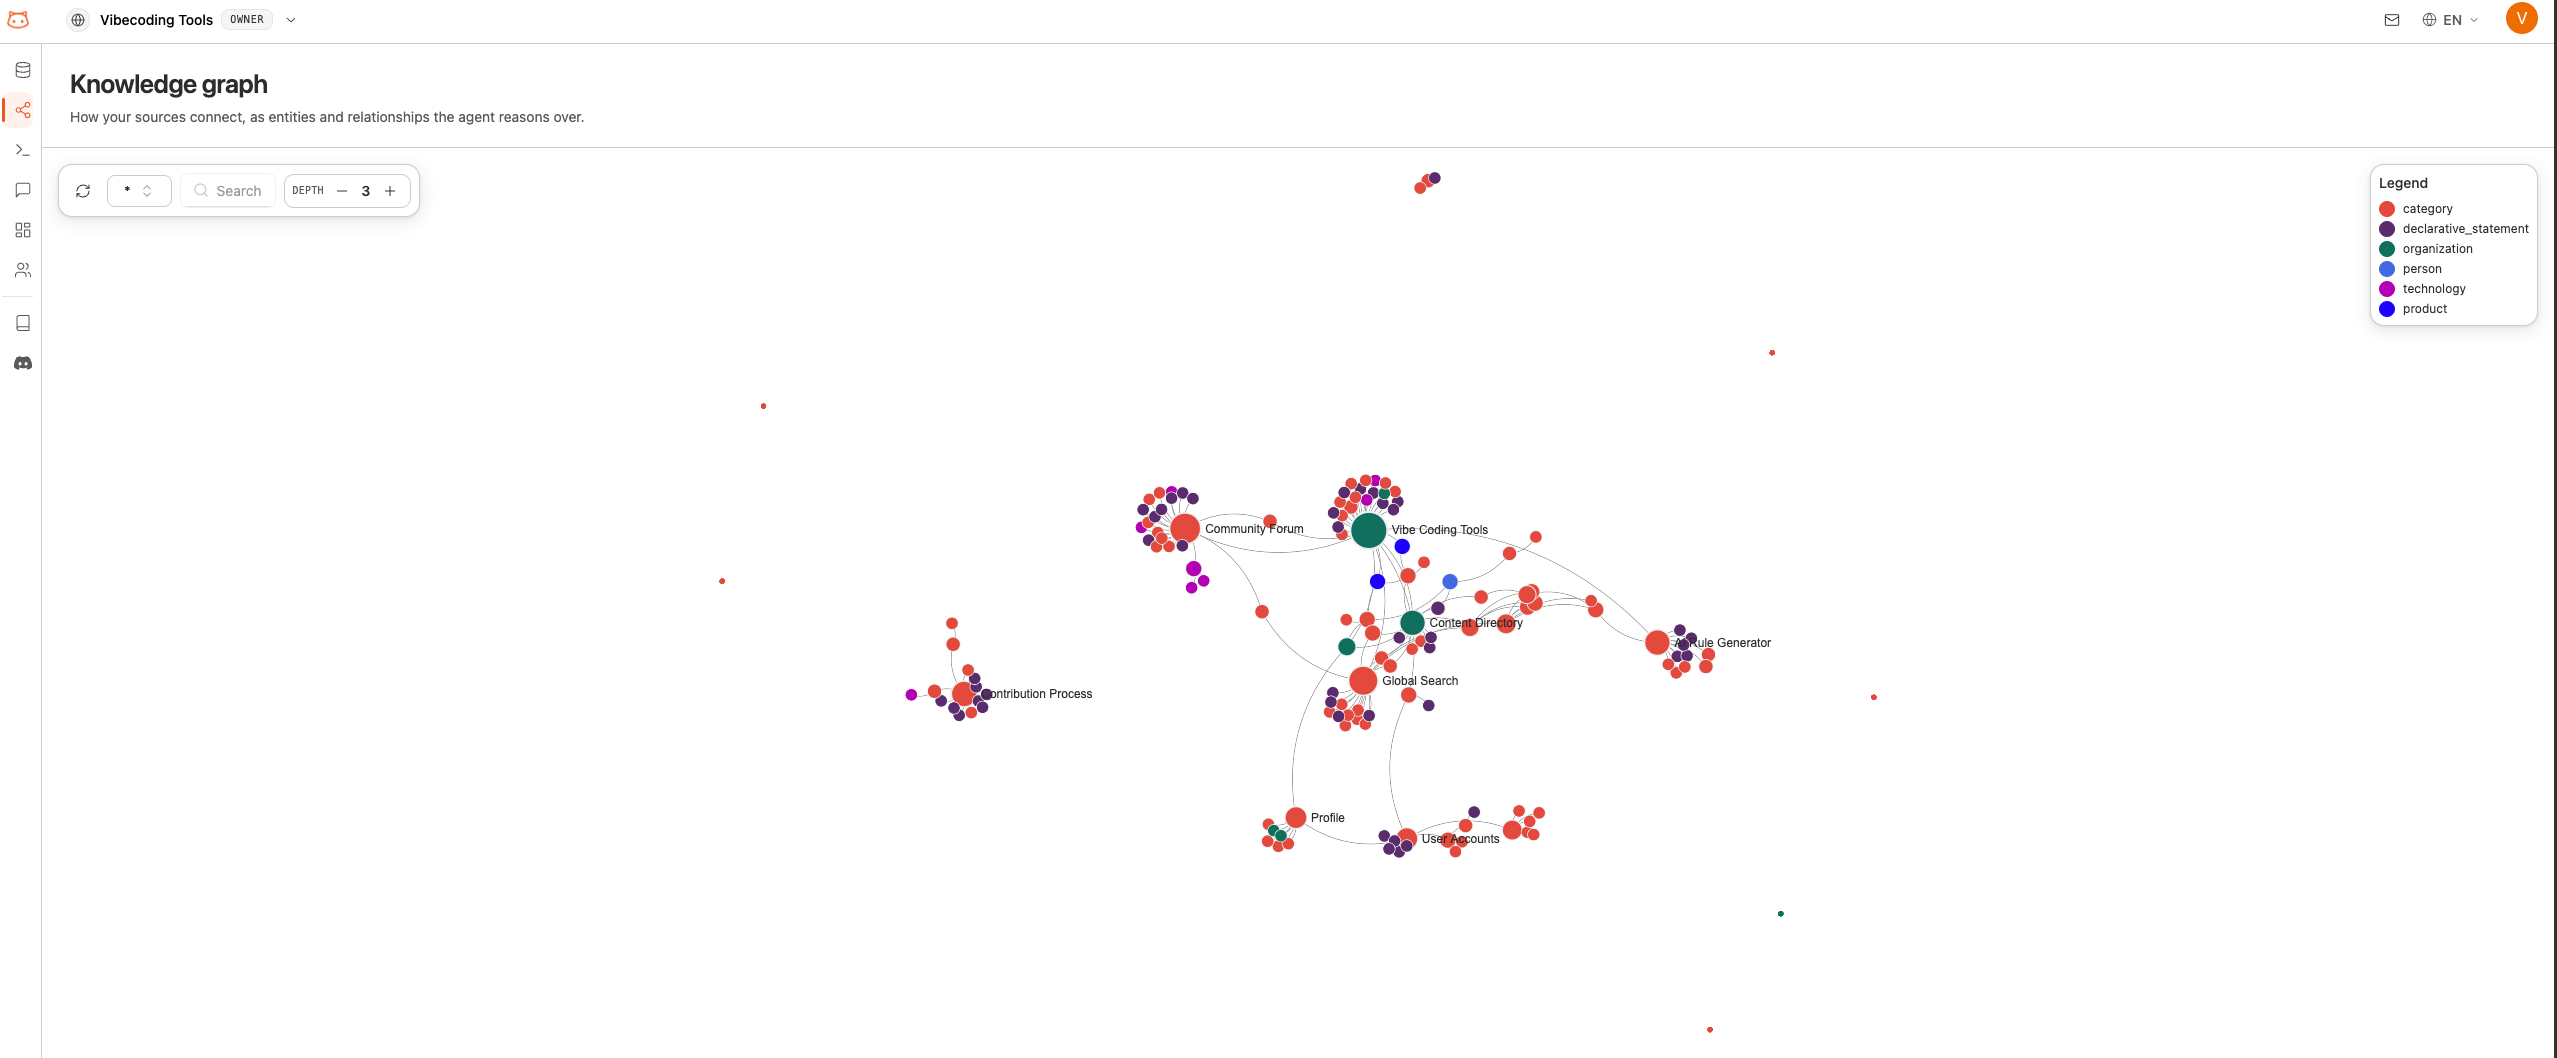
The knowledge graph displays:- Nodes: Individual concepts, topics, or entities extracted from your content
- Edges: Connections between related concepts
- Clusters: Groups of closely related topics that form natural categories
How to Use It
1
Open Graph Viewer
Open the Knowledge Graph section from the dashboard sidebar.
2
Explore Visually
The graph loads with all your content’s concepts displayed as connected nodes. You can:
- Pan: Click and drag to move around the graph
- Zoom: Scroll to zoom in or out
- Click nodes: Select a node to see its details and connections
3
Search for Topics
Use the search bar to find specific concepts. The graph will highlight matching nodes and their connections.
4
Use the Legend
The legend shows what different colors and node sizes mean. Larger nodes typically represent more connected or central concepts.
After Rebuilding
The knowledge graph updates automatically when you rebuild your knowledge base. After adding new content and rebuilding, revisit the graph to see how the new information connects to your existing knowledge.Next Steps
Customize Responses
Fine-tune how the bot communicates.
Test Your Bot
Verify the bot answers correctly.