Usage Tracking
BestChatBot tracks your monthly widget responses so you always know how much of your plan you’ve used. Usage resets at the beginning of each billing cycle.Viewing Your Usage
In the dashboard, you’ll find usage information in several places:Usage Indicator
A quick-glance indicator in the sidebar or top bar shows your current usage as a percentage of your plan limit.Usage Chart
The Billing section includes a chart showing your response usage over time, so you can see trends and predict when you might approach your limit.Workspace Distribution
If you have multiple workspaces (multiple widgets), you can see how usage is distributed across them. This helps you identify which sites are most active.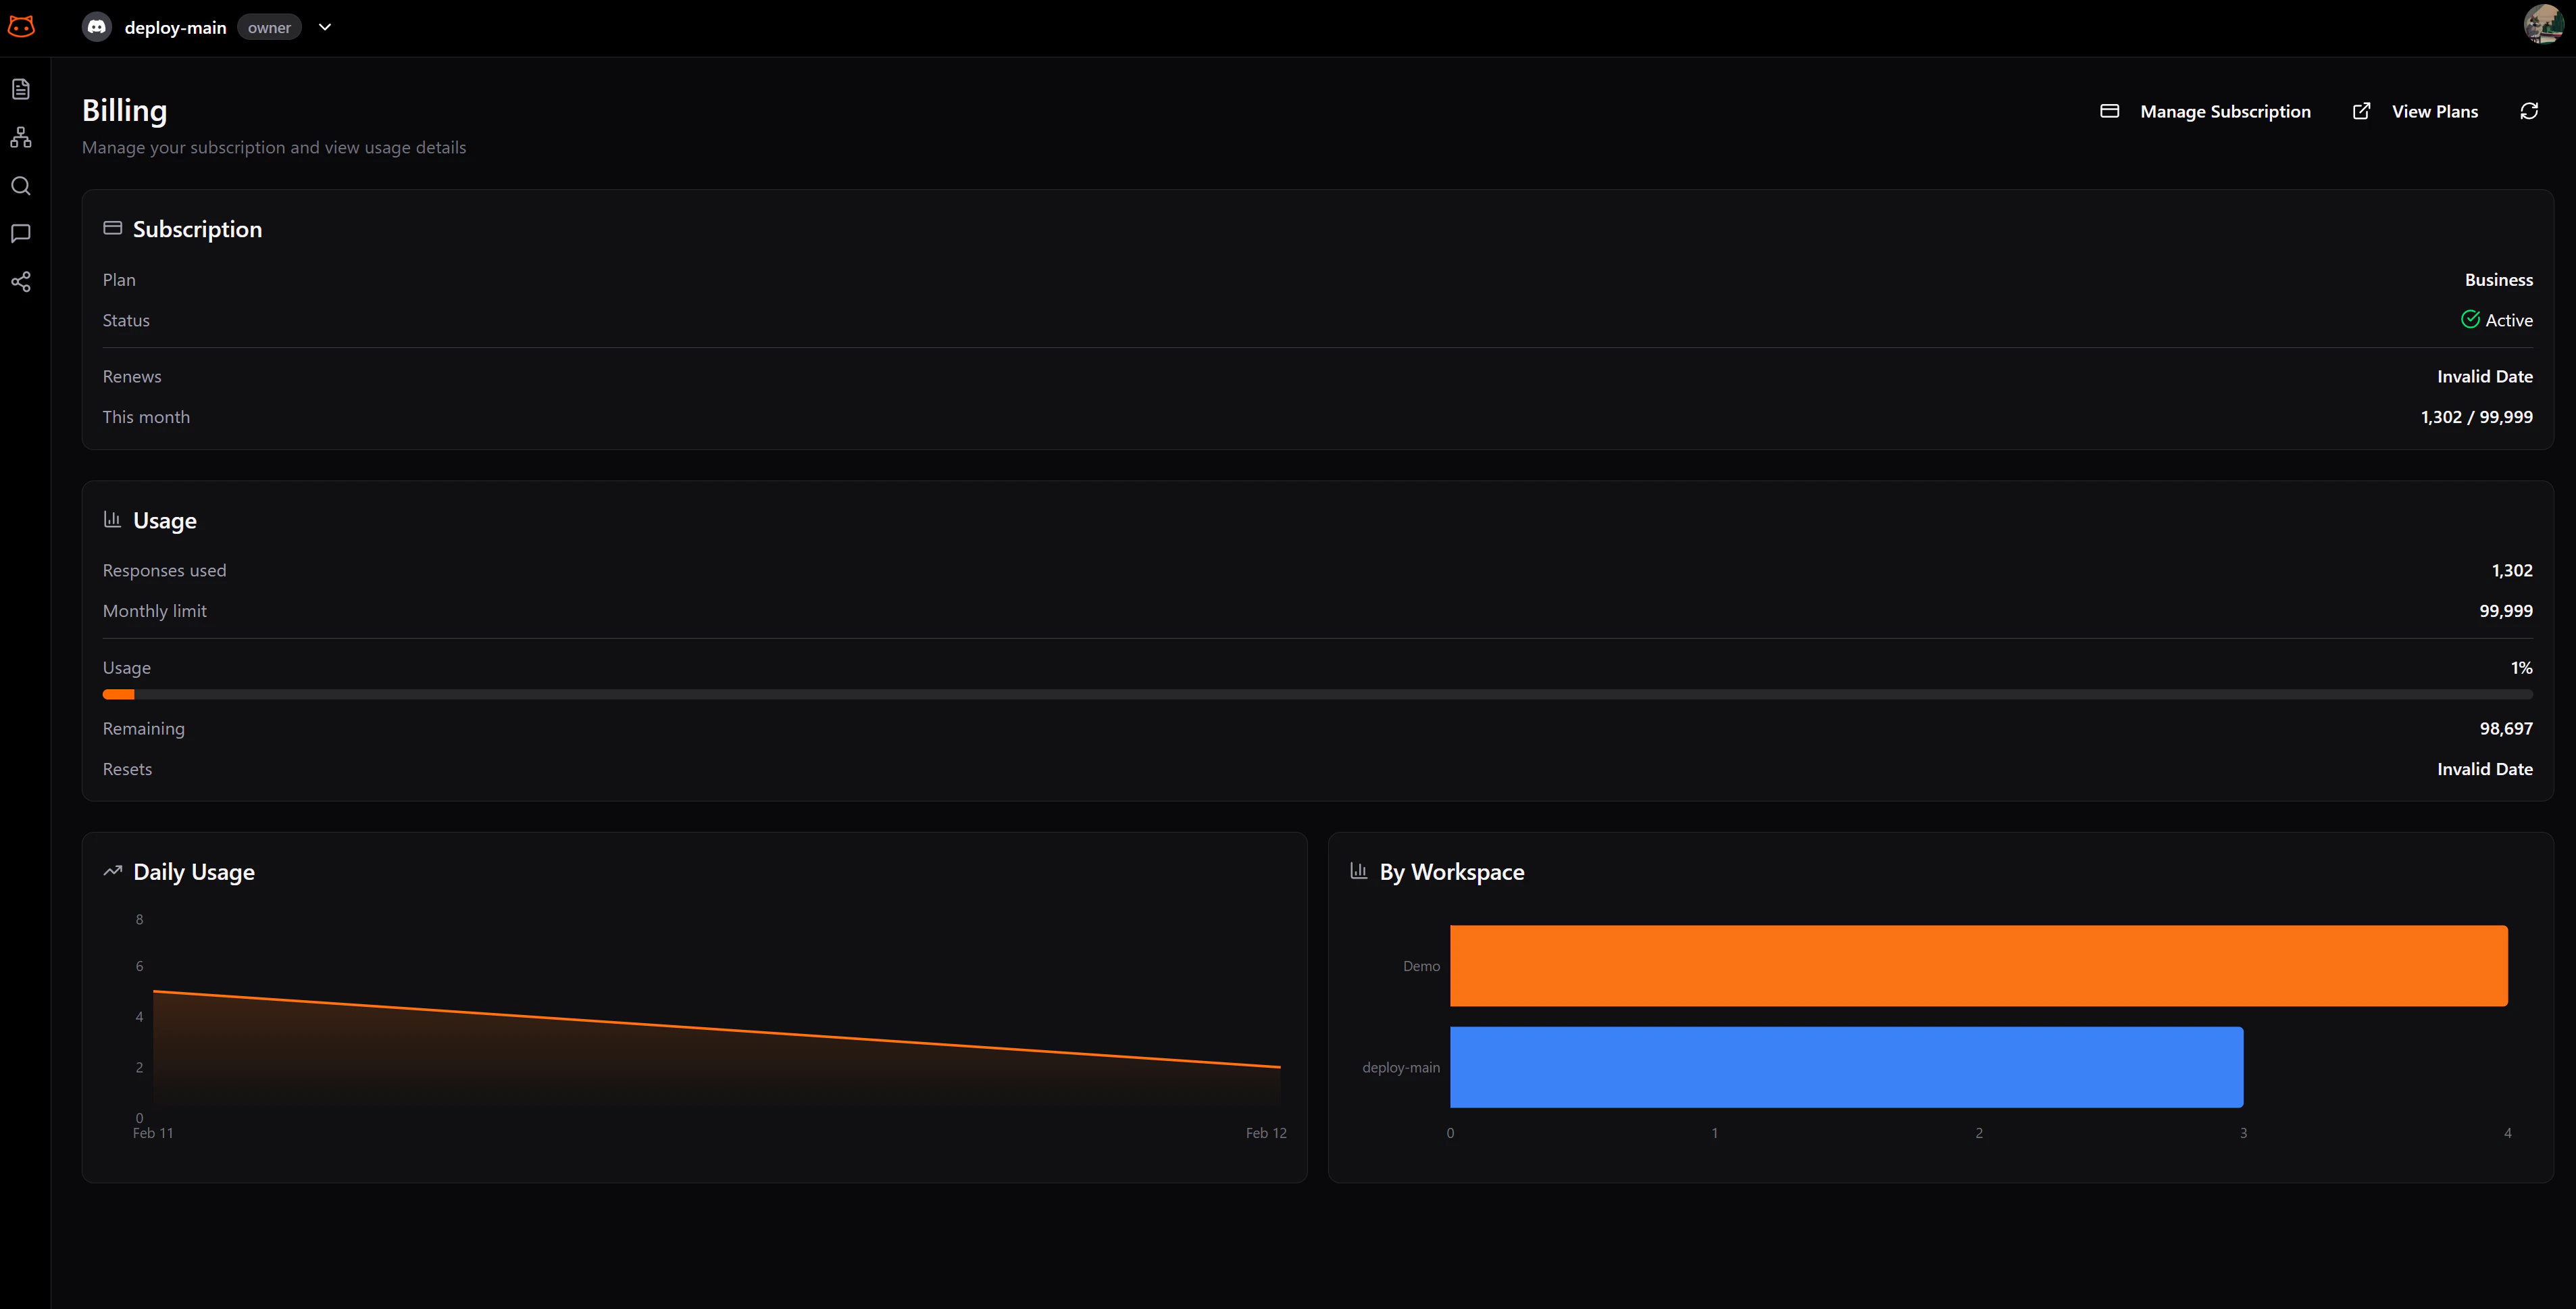
What Counts as a Response
A bot response is any answer the bot actually generates and returns — on your live widget or in the Retrieval Testing page. A successfully executed agentic action also counts. If the bot doesn’t deliver a result, you aren’t charged.Approaching Your Limit
When you’re nearing your monthly limit:- The usage indicator changes color to warn you
- You can upgrade your plan at any time to get more responses
Usage by Plan
Next Steps
Upgrade Your Plan
Need more responses? Upgrade anytime.
View Pricing
Compare all available plans.